Before the Holiday Rush: 6 Labor Numbers Multi-Store Dispensaries Should Review Now
.png)

Q3 just closed. At one of your stores, labor came in right where you planned. At another, overtime crept up every week in August, and nobody noticed until payroll. Both stores are heading into the busiest stretch of the year.
Q4 brings the holiday rush, including Green Wednesday, the day before US Thanksgiving. In 2023, Headset found that Green Wednesday sales were 52% higher than an average Wednesday. If a store's scheduling is already off track in October, Green Wednesday is where it shows: understaff it and you leave sales on the table, overstaff it and you pay premium hours for a hunch.
The quarter that just ended gives you the data to fix it. Here are six labor numbers to review across every location now, and how to run the review so it's done before holiday scheduling starts.
What Is a Q4 Labor Check?
A Q4 labor check is a short review of the past quarter's labor data, done at the start of October, to find problems before the holiday season. It compares each location's labor costs, hours, overtime, and staffing against its sales and against your other stores. The goal is to set Q4 schedules and budgets based on how each store actually performed, not on last year's plan.
For multi-store operators, the comparison is the most useful part. A number that looks fine on its own can stand out when you see it next to the same number at your other locations.
6 Labor Numbers to Review Before Q4
Each number below includes what to check and what to look for, so every store manager reviews the same things the same way.
1. Labor Cost as a Share of Sales
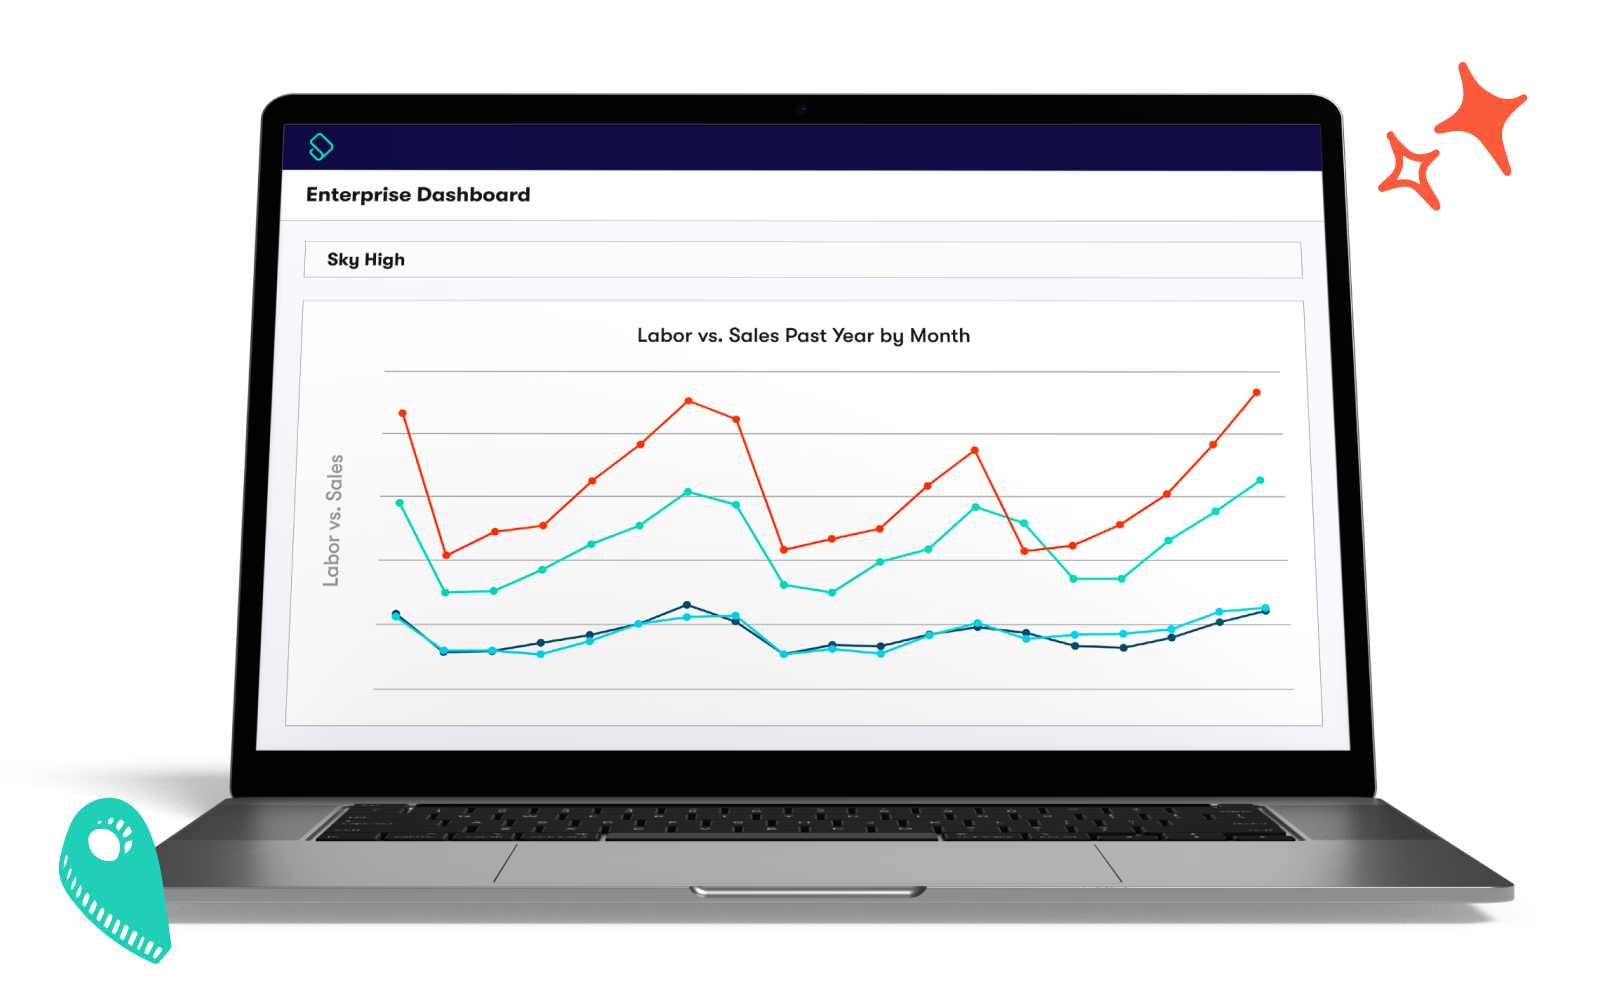
Start with labor cost divided by sales, by location and by month. Compare each store's Q3 result to its Q2 result and to your other stores. There's no single right percentage for every dispensary, because wages, store size, and traffic vary by market. Your own stores are the most useful benchmark.
What to look for: a store whose labor share went up while its sales stayed flat or dropped.
2. Overtime Hours
Look at total overtime by store, then by employee. Overtime spread thinly across a team is usually normal. Overtime concentrated on a few people or a few stores usually means those stores are understaffed or their schedules are uneven. It's also a burnout risk heading into the busiest weeks of the year.
What to look for: the same employees or the same stores showing up in overtime month after month.
3. Scheduled vs. Actual Hours
Compare the hours each store scheduled to the hours staff actually worked. A small gap is normal. A large, steady gap means the schedule isn't matching how the store really runs, whether that's late clock-outs, extra shifts added mid-week, or coverage that was never needed.
What to look for: stores where actual hours ran well above or below scheduled hours for most of the quarter.
4. Coverage by Hour
Daily totals can hide problems. Break labor down by hour and compare it to when customers actually come in. Many stores are overstaffed in the morning and short-staffed during the after-work rush. If you plan to extend hours or add staff for Green Wednesday, this is the data that tells you which hours need it.
What to look for: hours where staffing stays the same while traffic rises or falls.
5. Turnover and Open Roles
Count who left in Q3, from which stores, and how many roles are still open. Budtender turnover is high across the industry. A 2022 Headset analysis found that about 55% of budtenders who worked at some point in a 12-month period had left by the end of it. Every open role going into Q4 is a shift someone else has to cover, and new hires need time to train before the rush.
What to look for: stores with more departures than others, and roles that have been open for weeks.
6. Actual Labor vs. Budget
Finally, compare each store's actual labor spend to what you budgeted for Q3. This shows whether your budgets reflect reality. If a store missed its budget every month, the Q4 budget for that store should change too, either by adjusting the budget or by fixing what drove the gap.
What to look for: stores that were consistently over or under budget, and the reasons behind it.
How to Run the Review Across Every Location
A review only helps if it's done the same way at every store and finished before Q4 schedules are built.
- Pull the same reports for every store. Use the same date range, the same definitions, and the same format, so the numbers can be compared directly.
- Compare stores side by side. Look for the outliers first. They usually point to the biggest problems.
- Ask store managers what's behind the numbers. Data shows you where something changed. The manager usually knows why.
- Set Q4 targets per store. Use what you found to set labor targets, overtime limits, and hiring plans for each location before holiday scheduling starts.
KayaPush Reporting + Insights connects to your POS for labor and sales reporting, and tracks KPIs across all your locations in one dashboard. You can set alerts for when labor or sales percentages cross a threshold, so problems surface during the quarter instead of after it. KayaPush BI Insights lets you compare KPIs across all your dispensaries, drill down to day-by-day or hour-by-hour data, and compare actual labor to your budget. Scheduled reports can go straight to each store manager, so the review becomes a routine instead of a scramble.

Q4 Labor Check FAQs
How Often Should Dispensaries Review Labor Costs?
Review labor weekly at the store level and do a full review across all locations at least once a quarter. The start of Q4 is especially important, because it's your last chance to adjust before the holiday season.
What Is a Good Labor Cost Percentage for a Dispensary?
It depends on your market, wages, store size, and traffic. Rather than chasing an industry average, compare each store to its own past quarters and to your other locations. Big differences between similar stores are the most useful signal.
When Should Dispensaries Start Hiring for the Holidays?
Early enough for new hires to be fully trained before your busiest days. For most stores, that means starting in October. A consistent budtender training plan helps new hires get ready faster.
How Do You Compare Labor Across Multiple Dispensaries?
Use the same reports, date ranges, and definitions for every store, then compare the results side by side. Focus on ratios like labor as a share of sales rather than total dollars, so stores of different sizes can be compared fairly.
Go Into Q4 With Clear Numbers
The holiday rush rewards stores that are already running well and exposes the ones that aren't. A labor check now, using the quarter that just ended, gives every location a clear plan before the busiest weeks begin.
KayaPush brings labor, sales, and scheduling data together across every location, so you can see what's working and fix what isn't. Book a demo to see how it works for your team.