Business Intelligence
for data-driven success
Light up your data. Track sales, labor, and costs in real time, build custom dashboards, and blaze through the insights that keep your business rolling.
Awards

Data, Dashboards, and Decisions
Vibe by California needed better visibility into labor costs and performance across multiple locations. With KayaPush, they now track sales and staffing in real time, allowing them to make smarter scheduling decisions and cut unnecessary labor costs. Their management dashboard consolidates everything into one place, eliminating guesswork.
Learn how KayaPush saves Vibe by California an entire human per location!

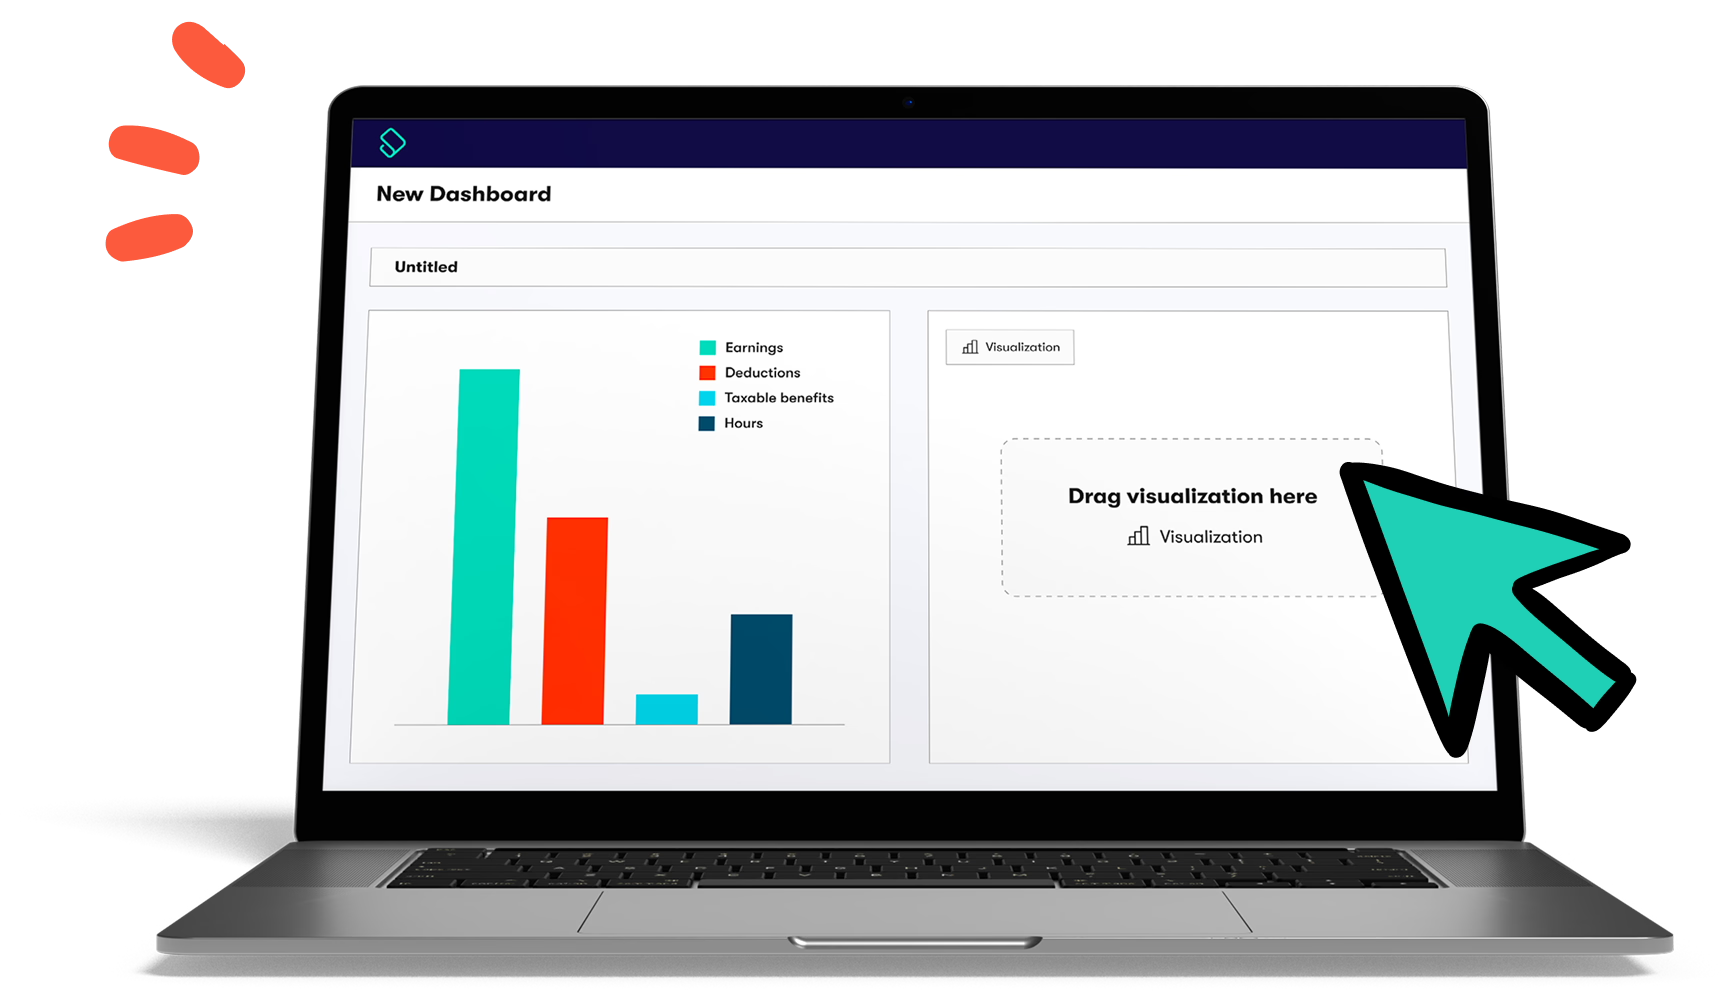
Custom Dashboards and Visualizations
- Build drag-and-drop dashboards tailored to your business’ specific KPIs and goals
- Create custom visualizations for sales, labor, costs, applicants, and other critical metrics
- Leverage prebuilt dashboards designed for the cannabis industry
- View everything in one place — from big-picture trends to granular details
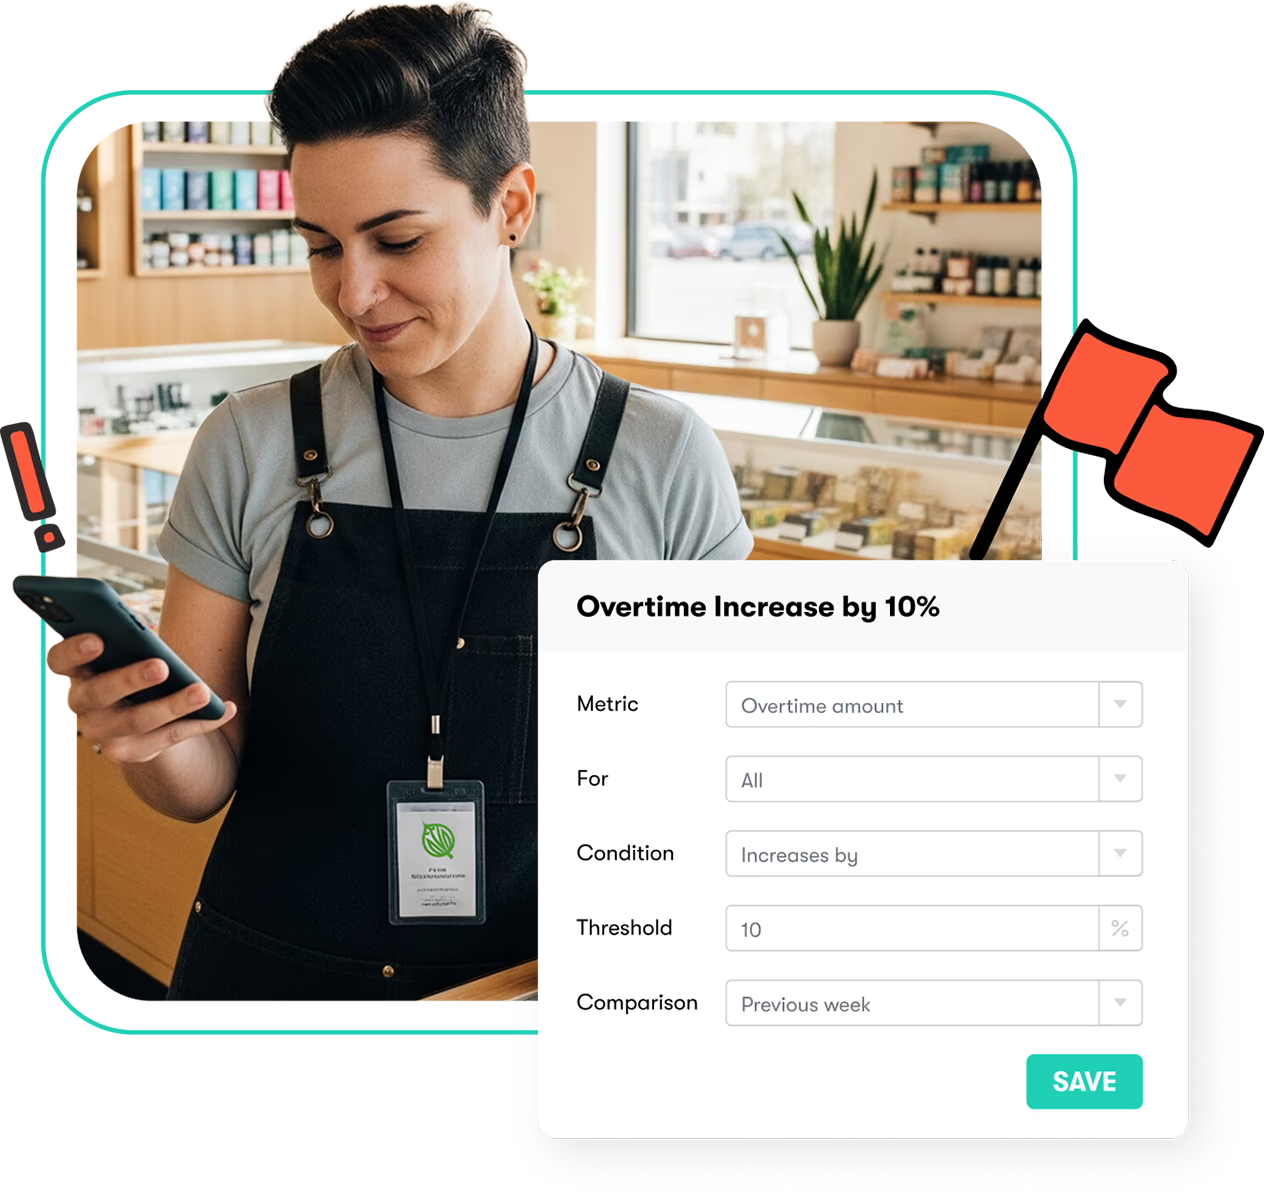
Real-Time KPI Alerts
- Get instant notifications when performance metrics cross key thresholds
- Monitor changes like labor cost spikes, sales dips, or overtime surges while on the go
- Customize alert conditions to match your operational priorities
- Route alerts to the right team members based on their location or role
Interactive Insights In Seconds
- Drill down from high-level views to day-by-day or even hour-by-hour data
- Cross-filter dashboards to focus on a single location, role, or metric
- Compare actual labor to budgeted forecasts to stay on track
- Toggle between visual charts, tables, and KPI summaries for strain free insights

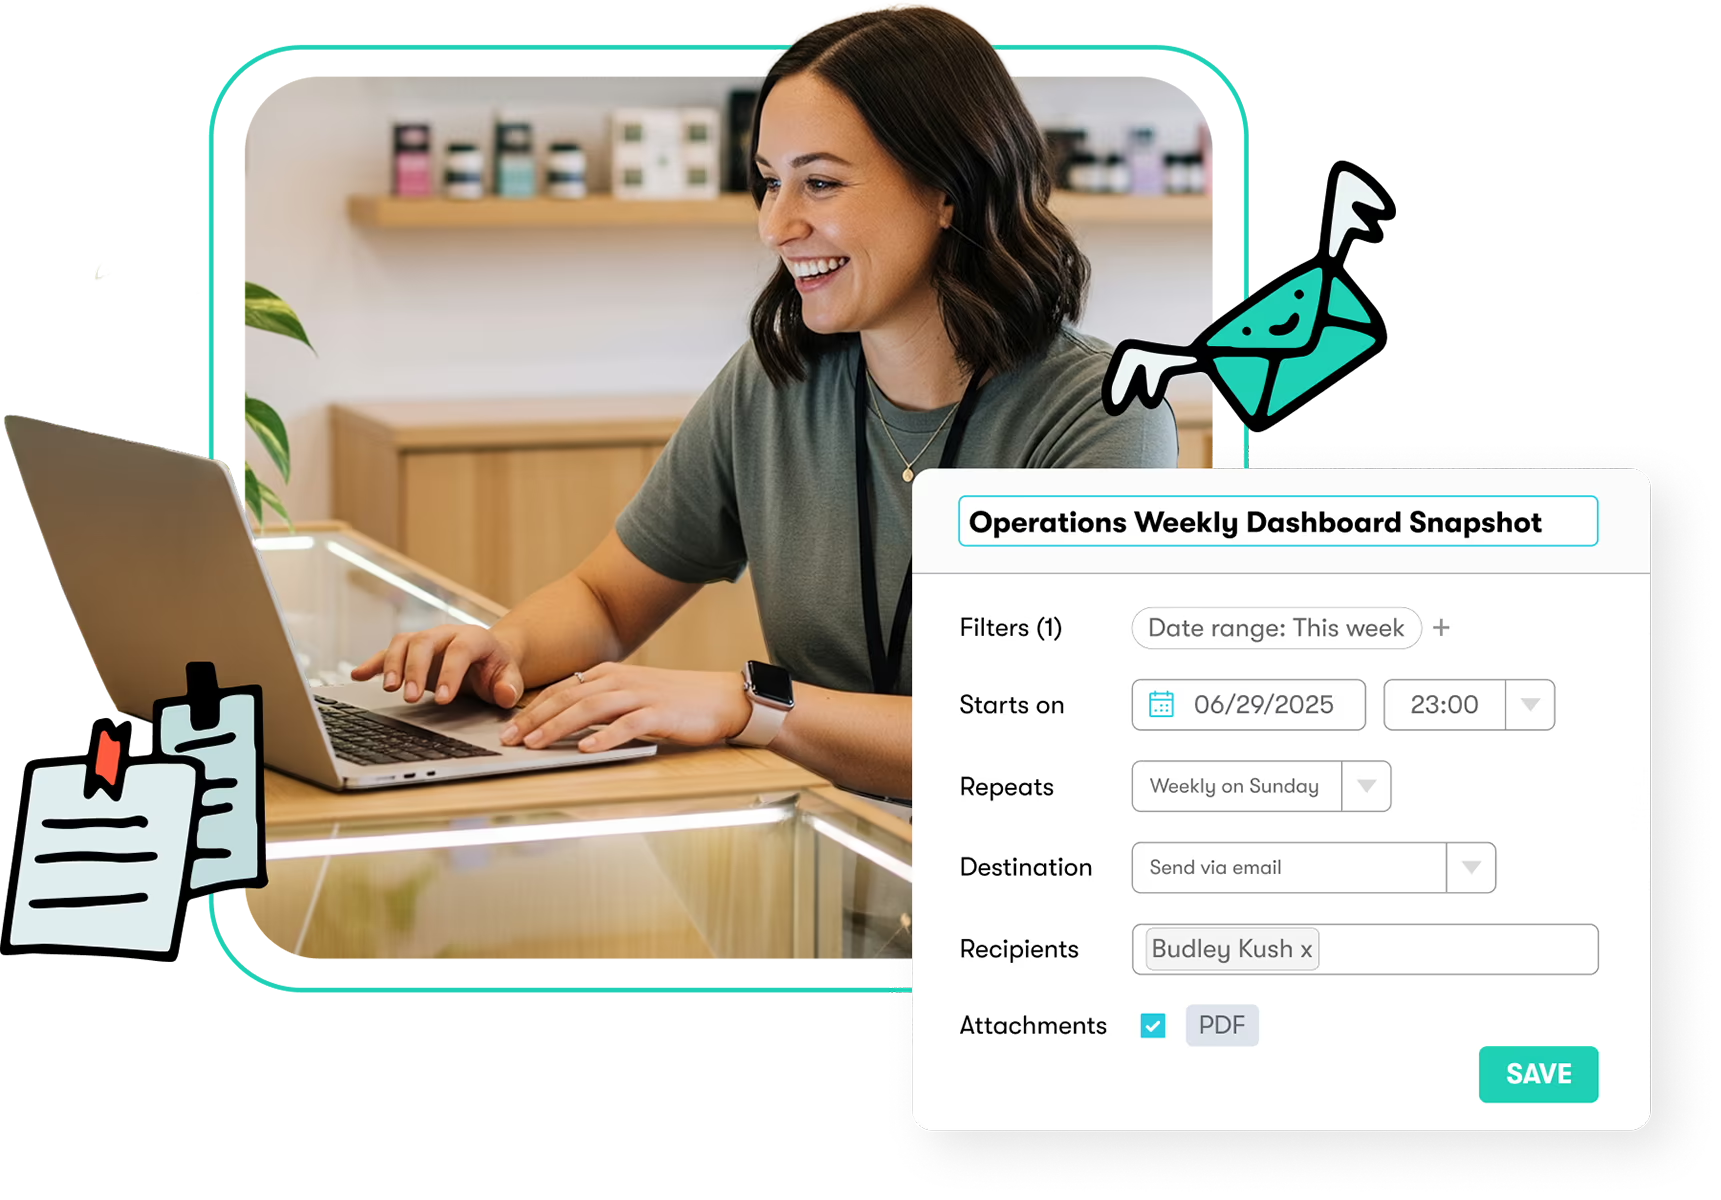
Automated Exports
- Automatically deliver scheduled reports to your team
- Export any view or report in formats like PDF, Excel, or CSV for easy sharing and analysis
- Apply custom filters so exports always deliver the exact data you need
- Keep decision-makers aligned at all times
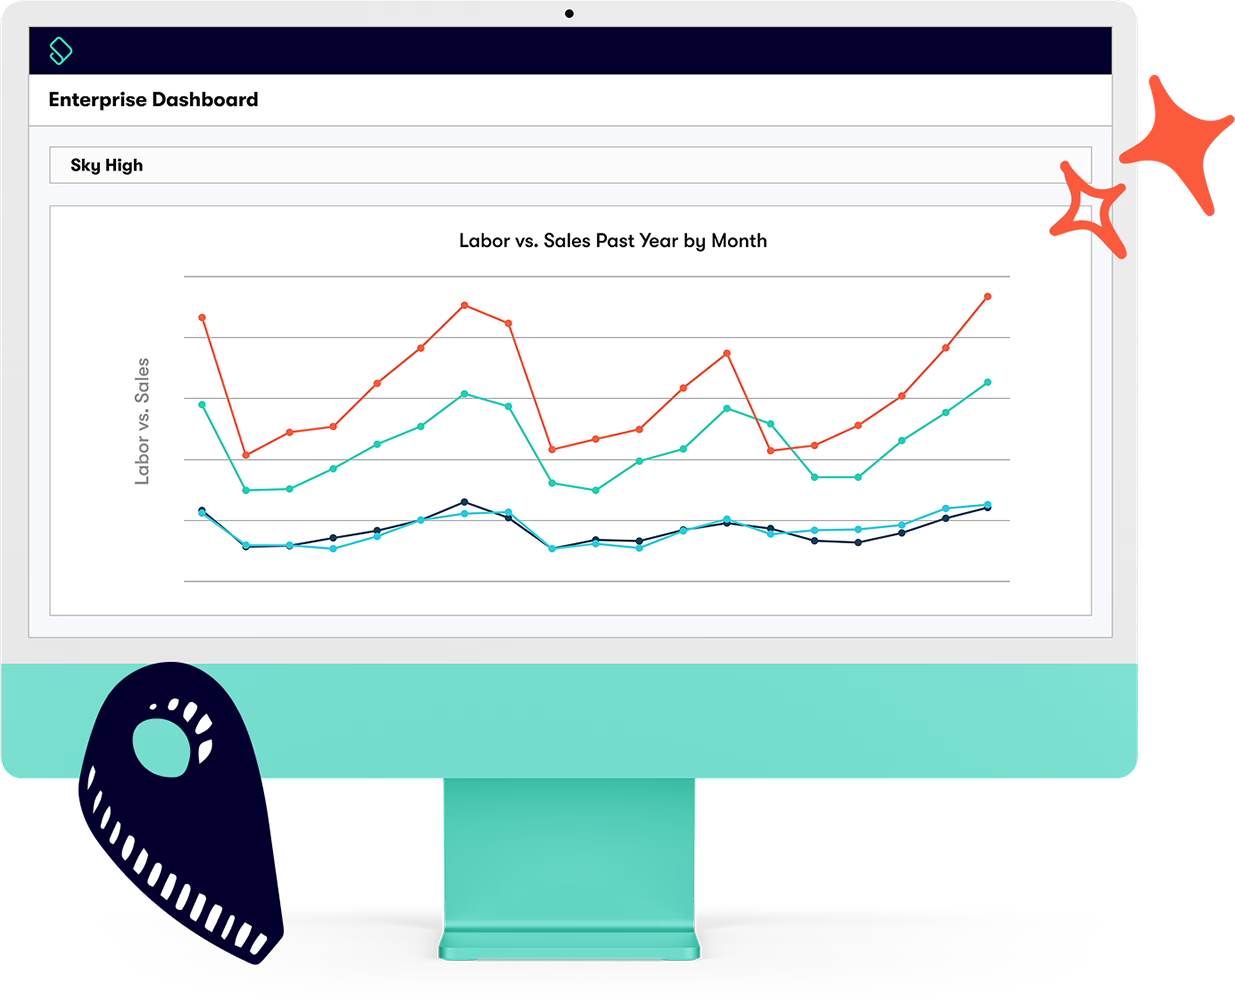
Multi-Location Visibility
- Compare KPIs across all your dispensaries at a glance
- Identify high-performing locations and areas needing improvement
- Filter and segment data to highlight trends by region, location, or vertical
- Maintain consistency in reporting while allowing local managers to focus on their own results
Testimonies slides
A little love from our best buds
“For cannabis retailers out there that are looking for an easy-to-use solution to manage your scheduling and labor costs, KayaPush has been a great product for us! The features have really helped us save a lot of money and time.”
Richard McLean, Head of Retail at
“KayaPush has helped with staff management by making it really easy from the very beginning when it comes to hiring, onboarding,and then scheduling. It’s foolproof and saves you time and money because it’s so quick.”
Monica Meiloaica, Co-Owner at
“The KayaPush software is beyond user-friendly. I tell my staff all the time that even if you haven't opened it before, you'll most likely be able to figure it out without having to do any training or research.”
Jessica Martin, Chief Operating Officer at
“KayaPush is a lifesaver because of its ability to save on costs and have payroll done in a smooth way.”
Jazz, Owner at
“The KayaPush software helps me maximize my profits. One of the most important benefits of KayaPush in my dispensary is the ability to view all activities on one screen and see how much we're spending on labor.”
Janet, Administrative Director at

Light Up Your Data
Turn data into decisions with BI Insights!


Awarded for what we do best
Awards